Background
This study is to estimate the inundation area during Harvey Hurricane 2017 in Houston, Texas, from Aug 27 to Sept 3, 2017 (Wikipedia). This hurricane is one of most costliest U.S. Atlantic hurricanes, that cost 125 billion USD. The similar costly hurricane is Katrina 2015.


SHUD Modeling
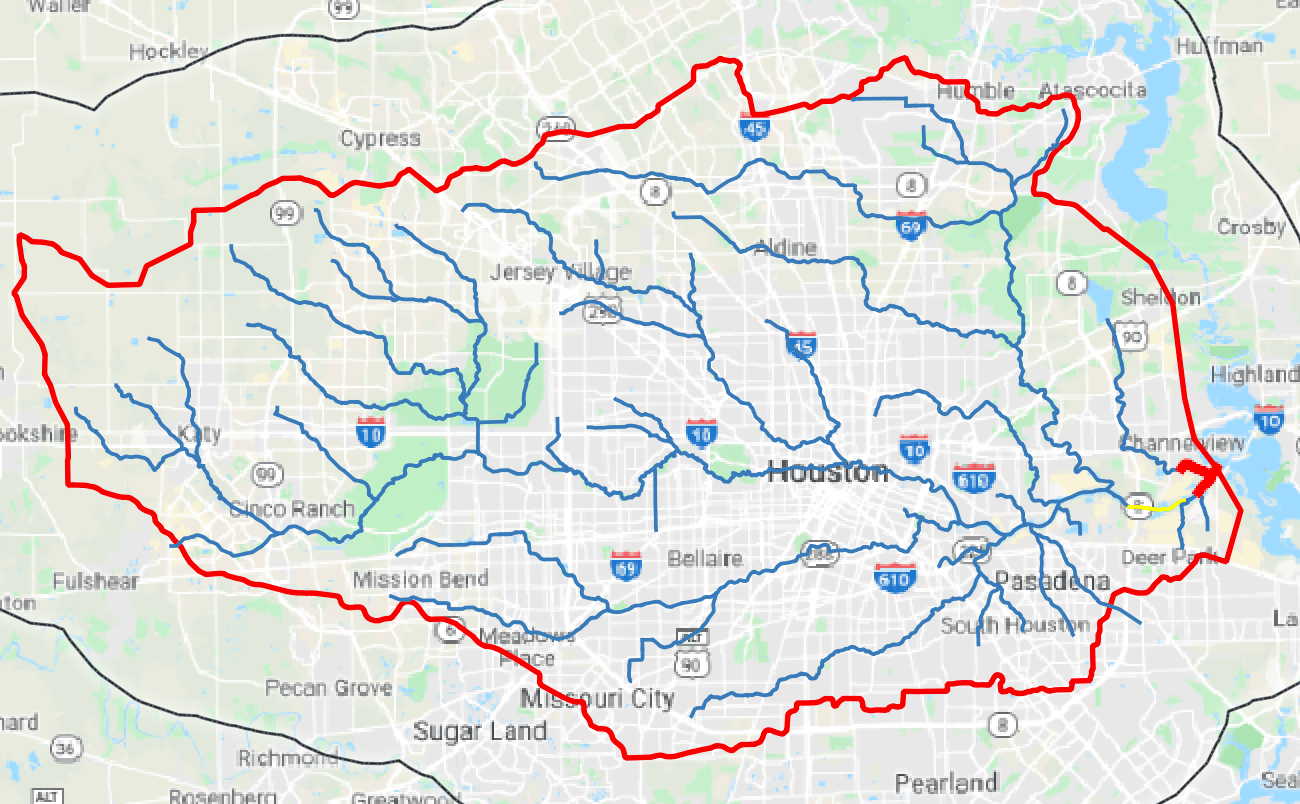
I select the Buffalo Bayou River (BBR) watershed that encloses Houston city as the modeling boundary.
Data
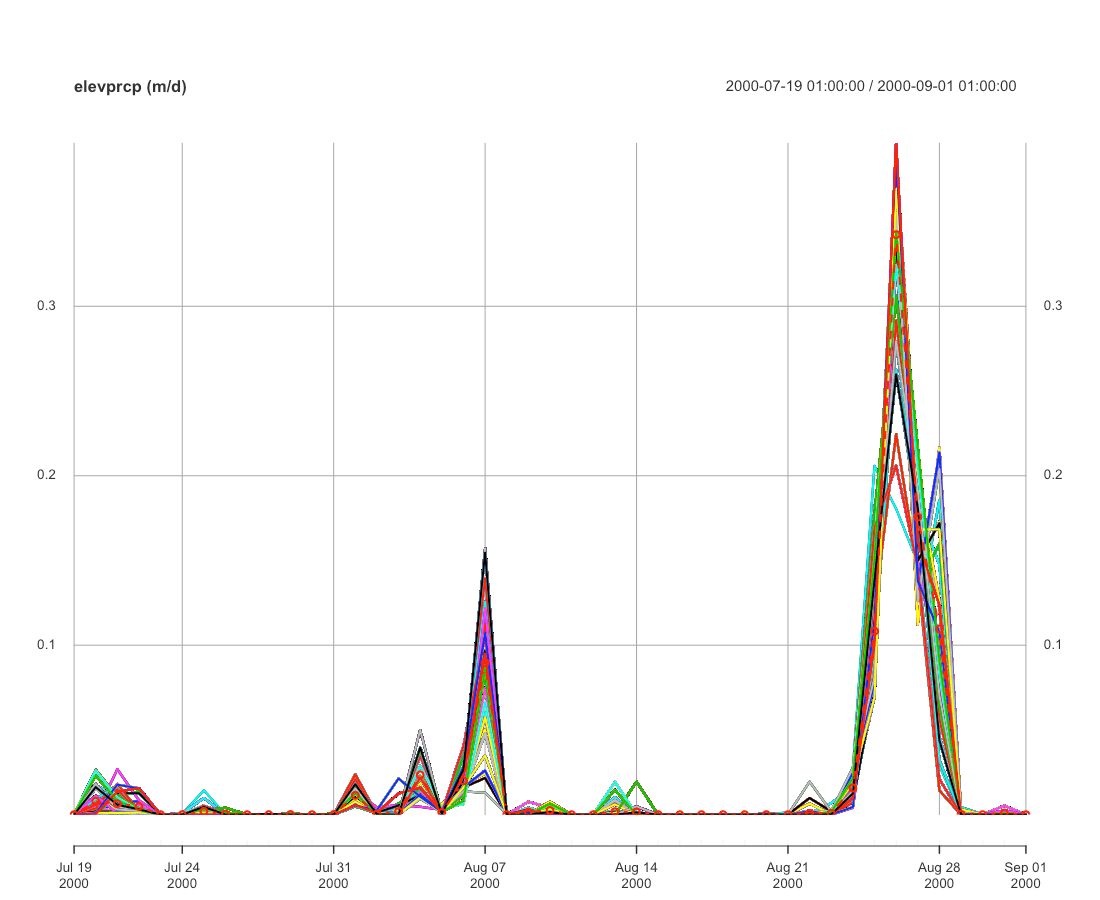
Meteorological data is from NLDAS-2 re-analysis data in the whole year of 2017.
Modeling domain
The rSHUD in R realizes the domain discretization, quasi-automatically. Figure and information about the modeling domain are shown below:
Table: Information of Model domain
| Item | Value | Unit |
|---|---|---|
| Number of elements | 8571 | |
| Number of river reaches | 392 | |
| Number of river order | 3 | |
| Number of river segments | 2057 | |
| Number of bank elements | 1607 | |
| Maximum elevation | 61.02 | $m$ |
| Minimum elevation | 0.11 | $m$ |
| Watershed area | 2713.53 | $km^2$ |
| Average element area | 0.32 | $km^2$ |
| Total river length | 696.70 | $m$ |
| Shortest river reach | 336.98 | $m$ |
| Average river slope | 0.00097 | $m/m$ |
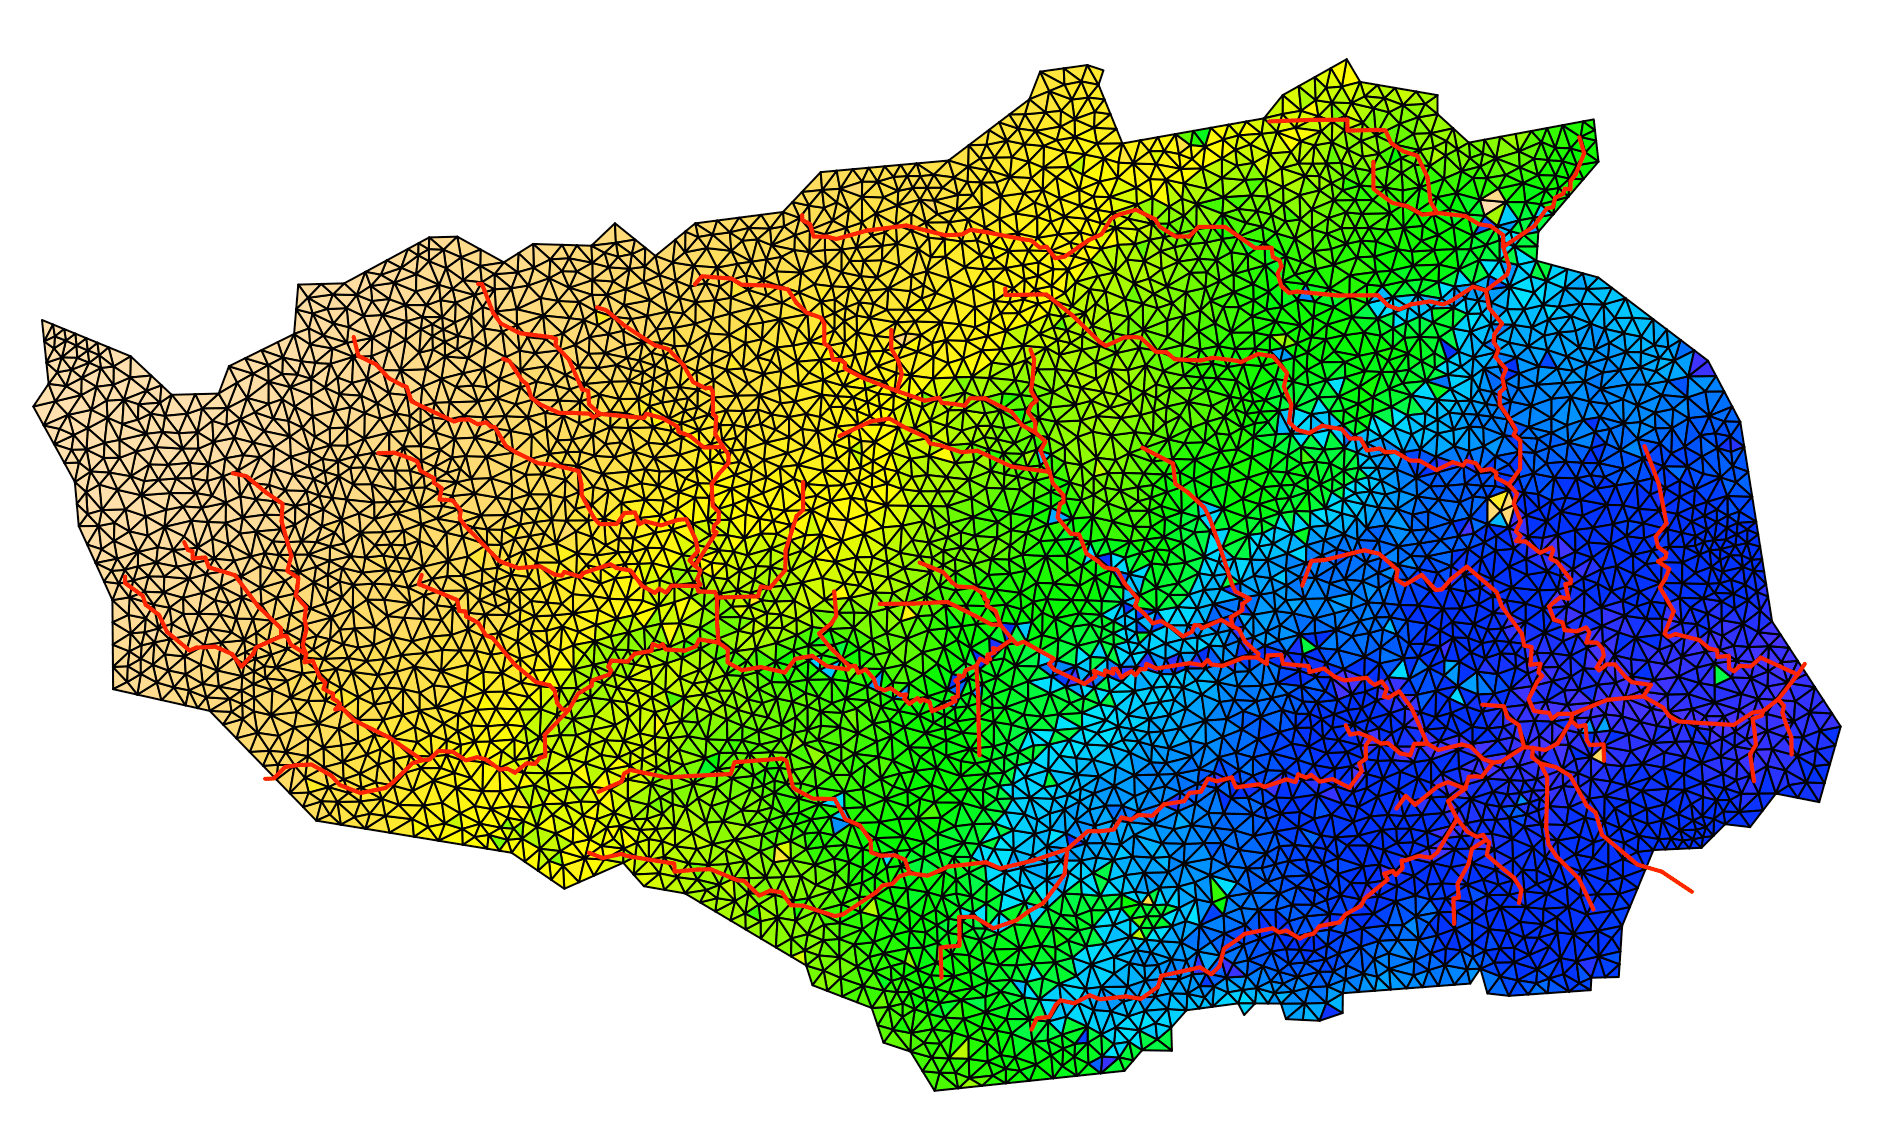
Hydrologic Unstructured Domains for Buffalo Bayou River (BBR) watershed. Color is elemvationf from 0 to 80 meters above sea level. Total number of elements is 8571; average area of the elements is 0.32 $km^2$— equivalence of $560m \times 560m$ resolution.
Results
Below is the simulated inundation area, compared to MODIS data.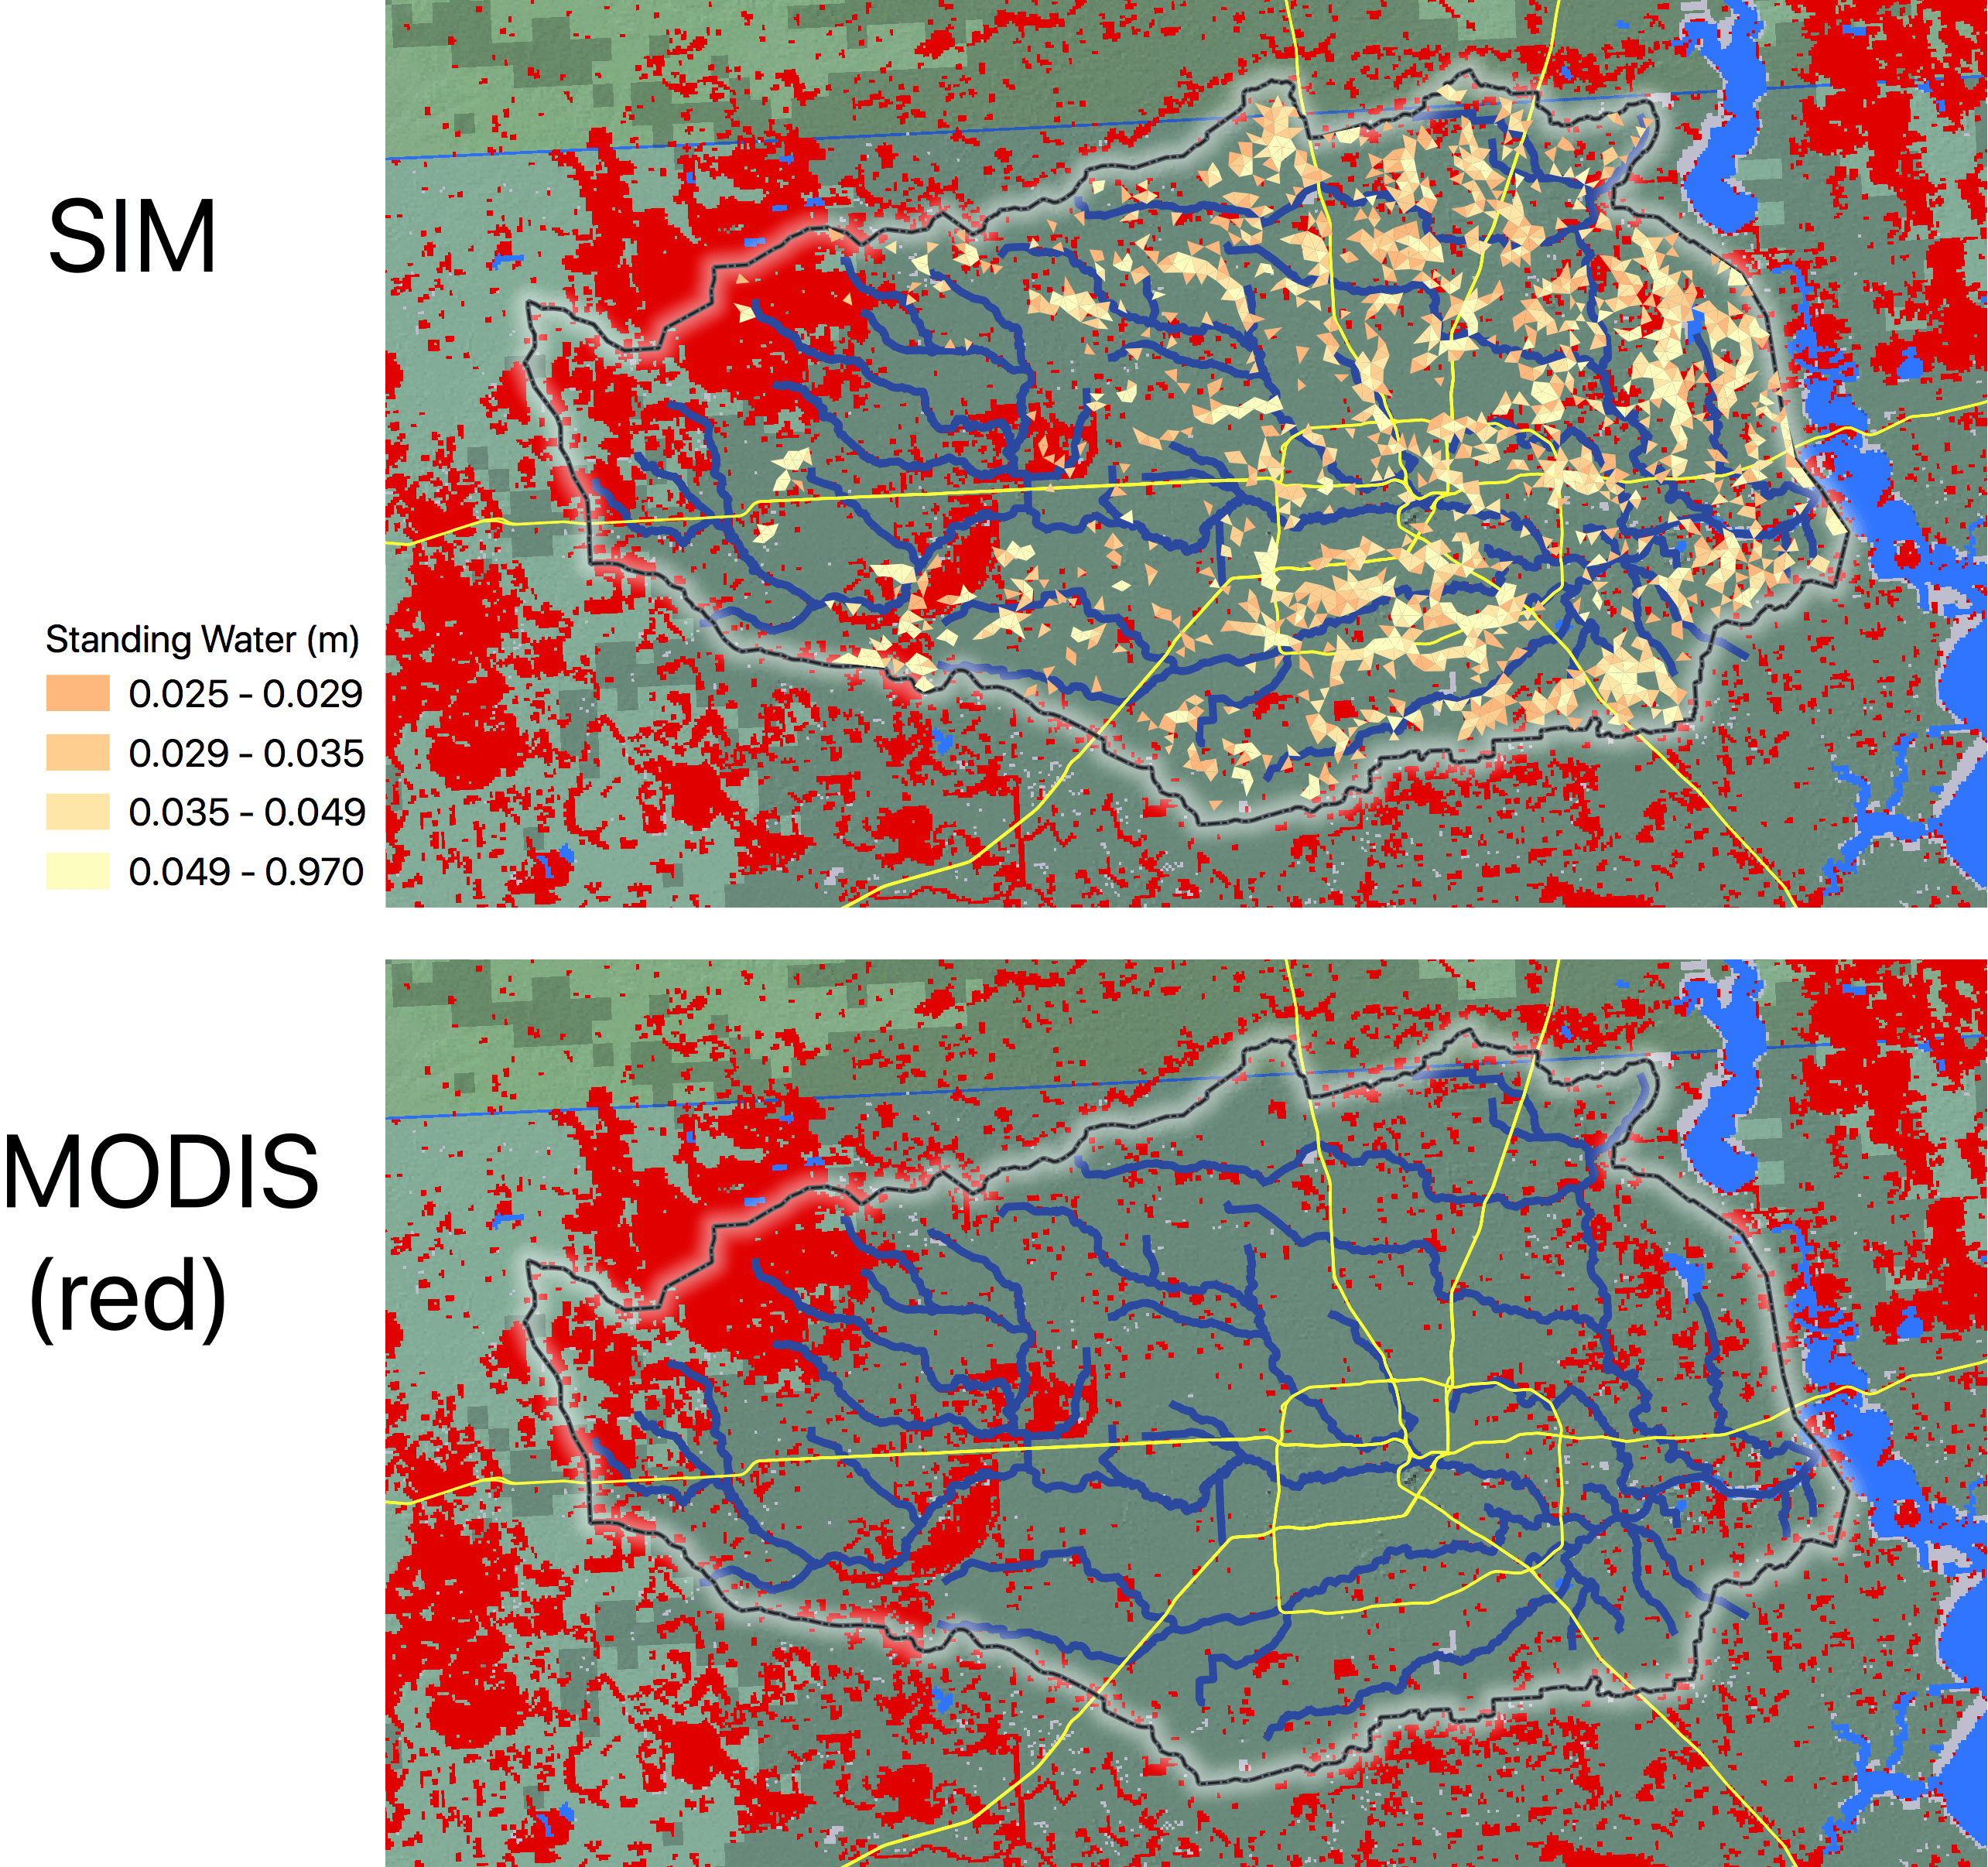
There is agreement, more or less, between the SHUD model and MODIS analysis. The analysis of MODIS data suggested the northwestern rural area was flooded, but the model simulation barely captured the inundation in those rural areas. In contrast, the flooding in urban areas was less in MODIS result than SHUD simulation.
The first question is: what was the real condition in the urbanized areas? Were they flooded or not? So the next step is to collect more local flooded data to validate the inundation area against model results and MODIS estimation.